

Presented by Bruce Hosler
Financial Market Quarterly Highlights, Q3 2021
- Domestic and international markets fell sharply in September, which weighed on quarterly returns.
- The economic recovery appeared to slow due to continued medical concerns and falling consumer confidence.
- Political risks at home and abroad led to uncertainty as we start the fourth quarter.
Rocky September Leads to Mixed Quarter
Markets pulled back sharply in September. The S&P 500 lost 4.65 percent for the month but gained 0.58 percent for the quarter. The Dow Jones Industrial Average fell 4.20 percent for the month and 1.46 percent for the quarter, and the Nasdaq Composite fell 5.27 percent for the month and 0.23 percent for the quarter. Fundamentals improved, however. According to Bloomberg Intelligence, as of October 1, the average second-quarter earnings growth rate for the S&P 500 was 96 percent, up from an estimated 65.8 percent. Technical factors for the month and quarter were also supportive. All three major indices remained above their 200-day moving averages throughout the period. This marks 15 straight months with continued technical support for the three major U.S. markets. International markets had a similar September. The MSCI EAFE Index of developed markets dropped 2.90 percent for the month and 0.45 percent for the quarter. The MSCI Emerging Markets Index fell further, dropping 3.94 percent in September and 7.97 percent for the quarter. Fixed income struggled as well, driven by rising long-term interest rates in September, with the 10-year U.S. Treasury yield increasing to 1.52 percent by month’s end. This led to a 0.87 percent decline in the Bloomberg U.S. Aggregate Bond Index for the month, though it managed a 0.05 percent quarterly gain.
Medical Risks Decline in September
We ended the month with a solid decline in the number of daily new COVID-19 cases in the U.S., and we saw similar improvements in terms of hospitalizations and deaths. This can be attributed to increased vaccination, with 55 percent of the population fully vaccinated and another 8.8 percent having received at least one shot.
Economic Recovery Slows
Medical concerns during the quarter were accompanied by increased economic risks. Job growth slowed sharply in August, and layoffs ticked back up in September, signaling potential weakness in the labor market. The expiration of federal support programs hit consumer confidence, which dropped during the quarter.
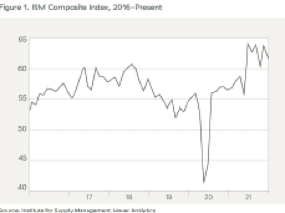
Spending held up well in August, despite declining confidence. Retail sales increased 0.7 percent and personal spending growth was up 0.8 percent. These results exceeded estimates and showed Business confidence and spending also showed signs of continued growth. The Institute for Supply Management (ISM) Composite index, a measure of manufacturer and service sector confidence, finished August at 61.5. As you can see in Figure 1, business confidence remains well above recent lows.
High levels of business confidence supported additional business spending and investment during the month and quarter. This should be a tailwind for growth through the end of the year.
Housing continued to be an area of strength, and sales remained well above pre-pandemic levels, supported by near-record-low mortgage rates and shifting consumer demand for more space.
Risks Shifting as We Head into the Fall
Political risks are real as we enter the fourth quarter. The last-minute deal at September’s end to avoid a partial government shutdown helped mitigate some risk, but ongoing negotiations over the debt ceiling and spending bills continue to rattle investors and markets.
Risks are also rising internationally. The slowdown in China and the concern over its property development sector aren’t expected to cause a global crisis, but the uncertainty is one more thing for investors to worry about.
The most likely path forward for the economy and markets is growth, as the economy still has momentum. A well-diversified portfolio that matches goals and timelines remains the best path forward for most. As always, speak to your financial advisor if you have concerns.
Information according to Bloomberg, unless stated otherwise.
Please see important disclosures below.
Disclosure: Certain sections of this commentary contain forward-looking statements based on our reasonable expectations, estimates, projections, and assumptions. Forward-looking statements are not guarantees of future performance and involve certain risks and uncertainties, which are difficult to predict. Past performance is not indicative of future results. Diversification does not assure a profit or protect against loss in declining markets. All indices are unmanaged and investors cannot invest directly into an index. The Dow Jones Industrial Average is a price-weighted average of 30 actively traded blue-chip stocks. The S&P 500 Index is a broad-based measurement of changes in stock market conditions based on the average performance of 500 widely held common stocks. The Nasdaq Composite Index measures the performance of all issues listed in the Nasdaq Stock Market, except for rights, warrants, units, and convertible debentures. The MSCI EAFE Index is a float-adjusted market capitalization index designed to measure developed market equity performance, excluding the U.S. and Canada. The MSCI Emerging Markets Index is a market capitalization-weighted index composed of companies representative of the market structure of 26 emerging market countries in Europe, Latin America, and the Pacific Basin. It excludes closed markets and those shares in otherwise free markets that are not purchasable by foreigners. The Bloomberg Aggregate Bond Index is an unmanaged market value-weighted index representing securities that are SEC-registered, taxable, and dollar-denominated. It covers the U.S. investment-grade fixed-rate bond market, with index components for a combination of the Bloomberg government and corporate securities, mortgage-backed pass-through securities, and asset-backed securities. The Bloomberg U.S. Corporate High Yield Index covers the USD-denominated, non-investment-grade, fixed-rate, taxable corporate bond market. Securities are classified as high-yield if the middle rating of Moody’s, Fitch, and S&P is Ba1/BB+/BB+ or below.
Authored by Brad McMillan, CFA®, CAIA, MAI, managing principal, chief investment officer, and Sam Millette, manager, fixed income, at Commonwealth Financial Network®.
© 2022 Commonwealth Financial Network®